Vigil: Producing the Receipts When Your ISP Won’t
Today I’m open-sourcing Vigil, a continuous network reliability monitor with a desktop UI. It runs in your system tray, pings the things you actually care about — your router, anycast DNS, the call-quality endpoints behind Teams, Zoom, and Outlook, public STUN servers — every 2.5 seconds. It detects outages live. And it produces the evidence you hand to a person who keeps insisting “the network is fine.”
Why I Built This
I live in a managed building. The building has a contract with one ISP. I don’t get to pick.
That trade-off was fine until the network started failing in ways that affected work. Slack huddles drop on certain afternoons. Zoom calls degrade past the 40-minute mark. Some weekday evenings, screen-sharing freezes for ten seconds and recovers itself. The pattern is intermittent — never the entire day, never every meeting — which is exactly the failure mode that’s hardest to escalate.
The escalation loop went the way these always go. The property manager’s first response was “have you tried restarting your modem?” The ISP’s first response, after I called, was that the line tested clean and “the issue must be inside the unit.” The building blamed the ISP. The ISP blamed the equipment. The equipment is fine. I have a stand-up to run.
The pattern is clear: when a network is unreliable and you don’t control the underlying infrastructure, the burden of proof lands on the person who’s mad. You need a written record showing that the failures were theirs, on their schedule, against targets they can’t dismiss.
So I built one.
Why “Vigil”
Vigil is named after the Vigiles — Rome’s night watch. All of my products follow a Roman theme. The Vigiles patrolled the city after dark, watching for fires and break-ins, sounding the alarm when something was wrong. They didn’t put the fires out themselves; their job was to notice and to make a record. That’s exactly the role I needed: a process that watches the network, in the background, and produces the receipt when something goes wrong.
What It Does
Vigil runs as a desktop app in the system tray. The dashboard is the page you see if you pop the window open during the workday:
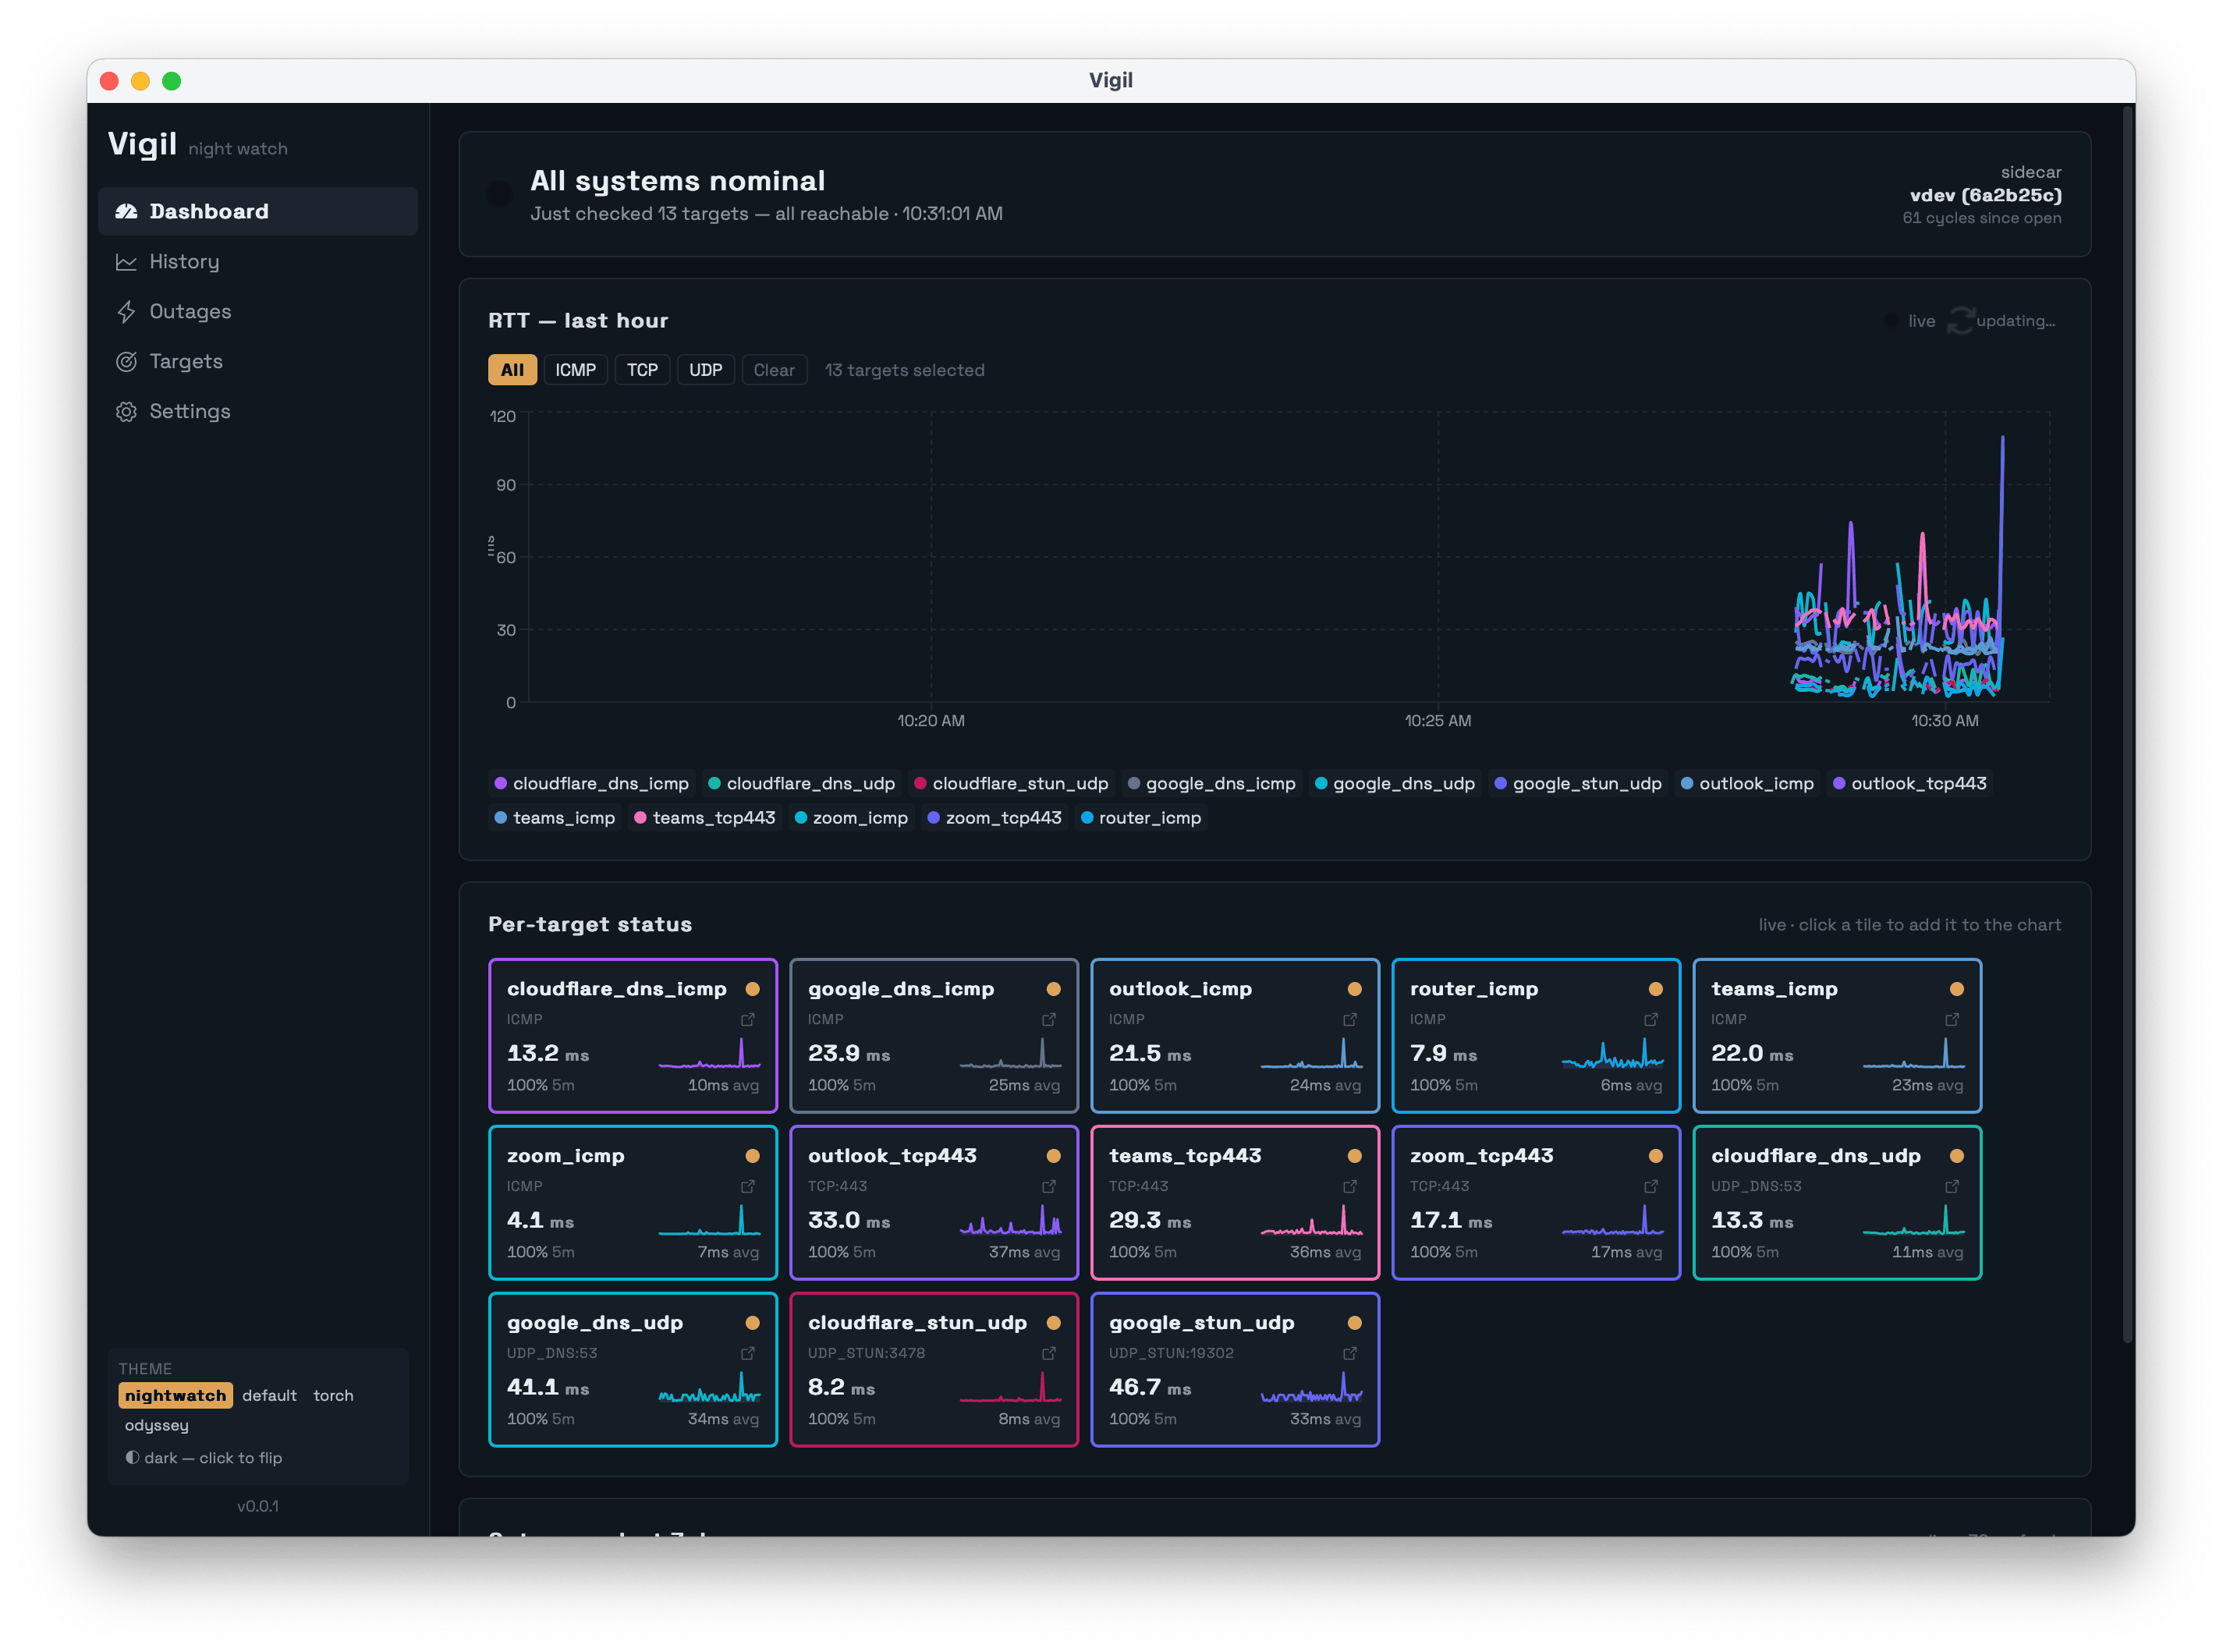
Every 2.5 seconds, Vigil runs thirteen probes in parallel:
- Router (auto-detected via the OS routing table) over ICMP — proves the LAN is healthy.
- Google DNS, Cloudflare DNS over ICMP and UDP/53 — proves anycast resolvers are reachable.
- Teams, Zoom, Outlook endpoints over ICMP and TCP/443 — proves the actual call-quality services are reachable, not just generic infrastructure.
- Public STUN servers over UDP — proves NAT traversal works, which is what real-time voice/video actually needs.
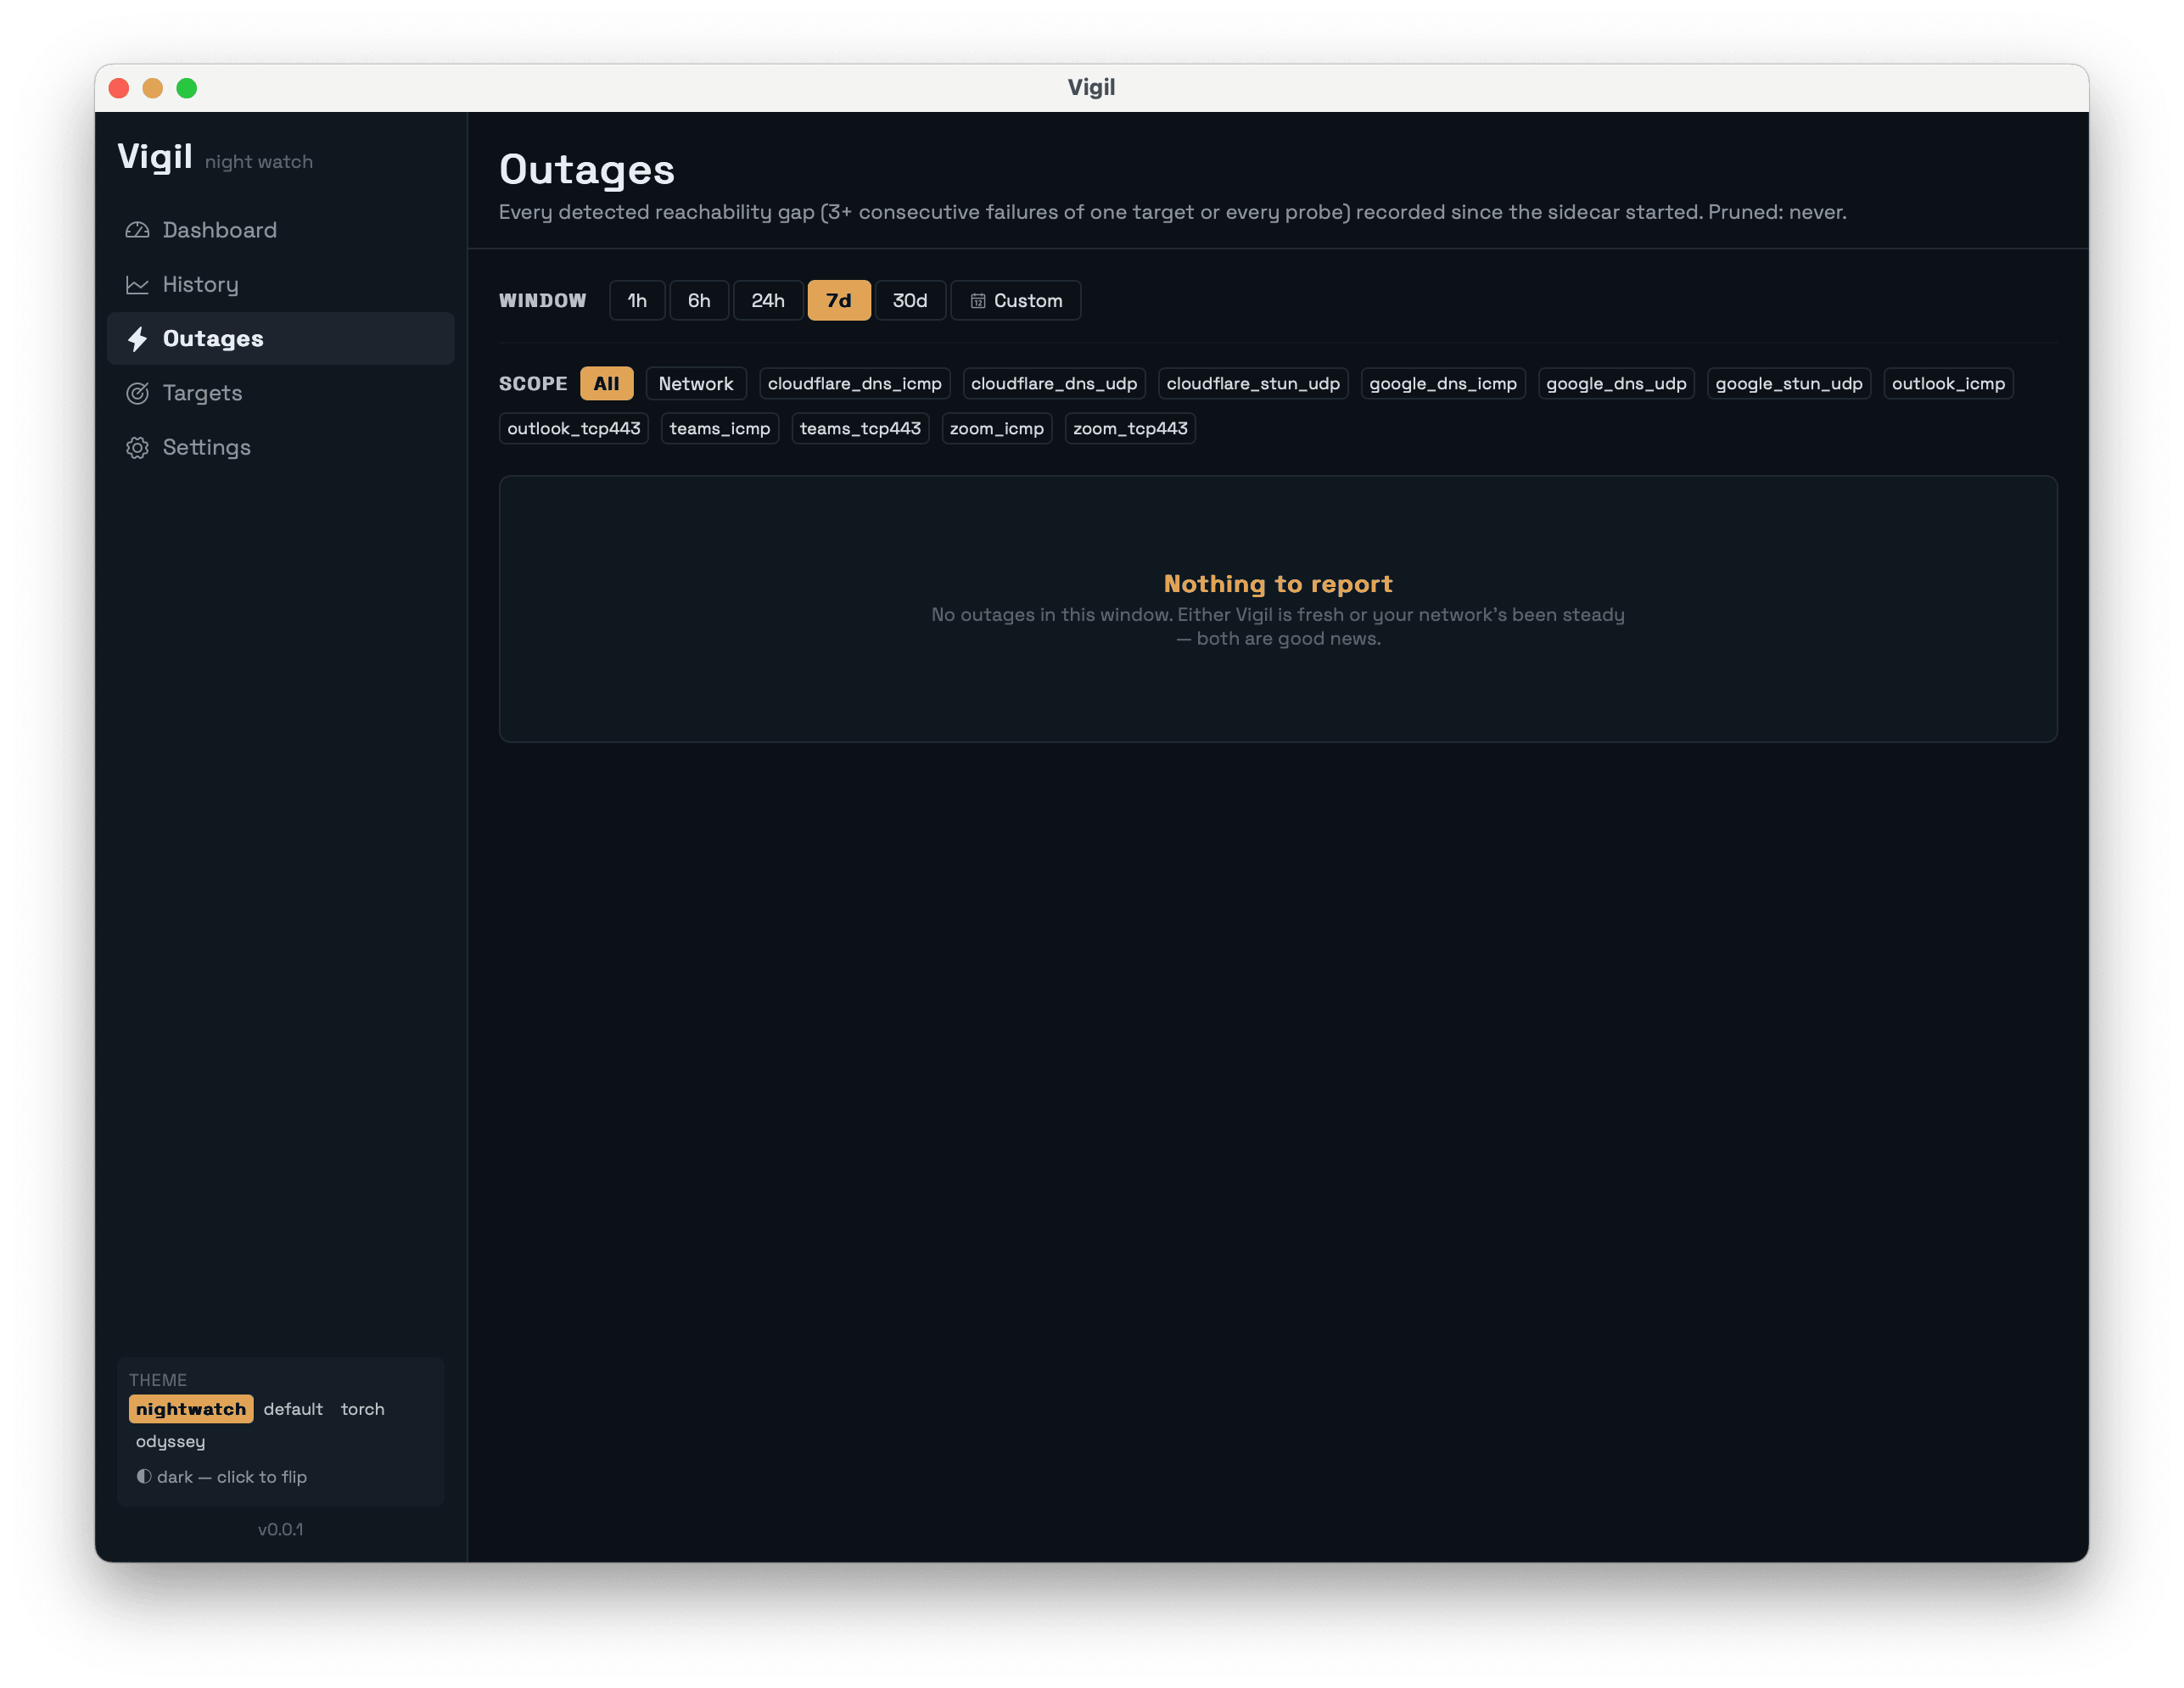
Three consecutive failures of the same target trigger an outage row with a precise start timestamp. The next successful probe closes it with a precise end timestamp. The Outages page is the artifact that ends arguments:
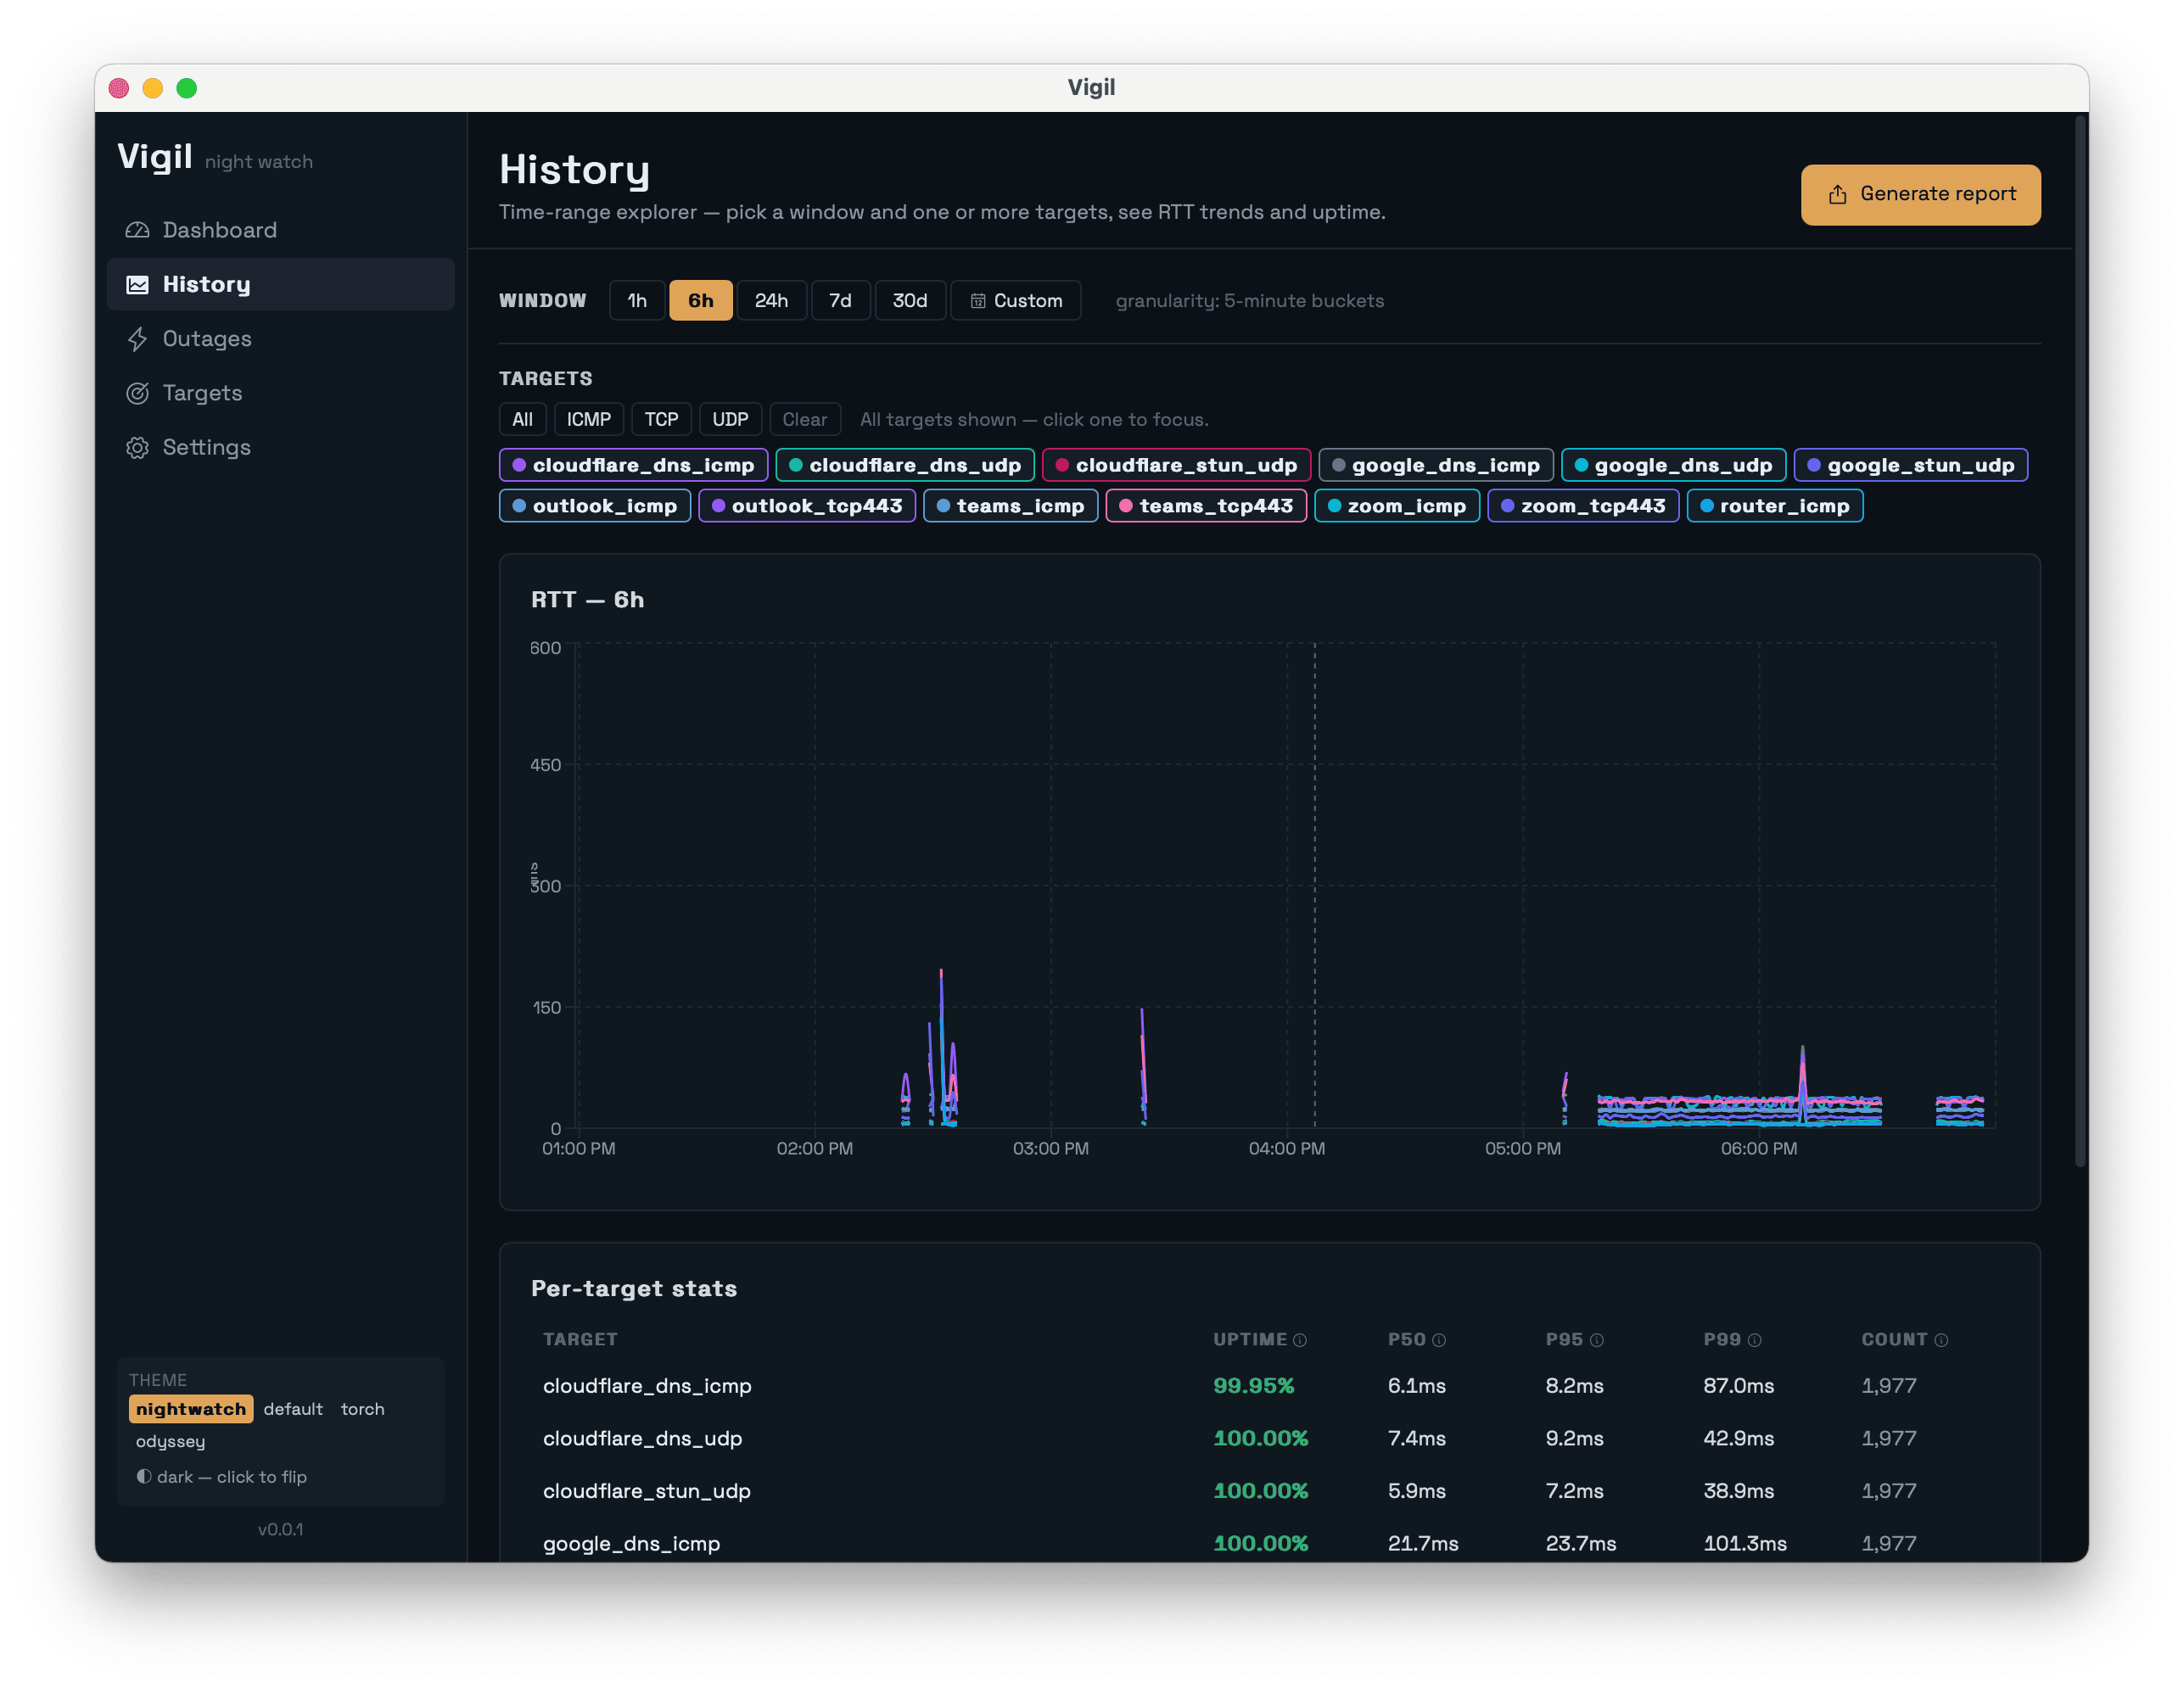
A History page lets you query any time range, pivot per-target, and see uptime / p50 / p95 / p99 stats:
The Report Generator outputs CSV, JSON, or HTML. The HTML report is the one that matters: a self-contained file you can email to your ISP that includes uptime percentages, p50/p95/p99 latency, error-code breakdowns, and a timeline of every outage. No “trust me.” Receipts.
How It Works
The architecture splits work between a thin Rust shell and a fat Go sidecar:
┌─────────────────────┐     stdio JSON-line      ┌──────────────────────┐
│   Tauri 2.x shell   │◀────────────────────────▶│   Go sidecar         │
│   (Rust, ~150 LOC)  │                          │  (probe loop, DB,    │
│   tray, window,     │                          │   aggregator,        │
│   updater, IPC      │                          │   outage detector)   │
└──────────┬──────────┘                          └──────────┬───────────┘
           │                                                │
           │ Tauri events                                   │ Ent ORM
           ▼                                                ▼
┌─────────────────────┐                          ┌──────────────────────┐
│  React + Tamagui    │                          │  SQLite              │
│  (dashboard, hist., │                          │  (modernc.org/sqlite,│
│   outages, report)  │                          │   pure Go, no cgo)   │
└─────────────────────┘                          └──────────────────────┘
The shell exists for things only the OS can do — system tray, window lifecycle, auto-updater. Everything else lives in Go. ICMP uses pro-bing (unprivileged ICMP sockets), Wi-Fi info on Linux uses mdlayher/wifi (pure Go netlink — no shell-out to iwconfig), and the database uses modernc.org/sqlite so the binary cross-compiles cleanly without cgo. The split keeps the Rust surface area small enough that adding macOS, Windows, and Linux support didn’t multiply the work.
The Aggregation Tiers
The naive approach to a continuous monitor is “keep raw samples, prune after 30 days.” That’s fine for a week. Run it for three months and your SQLite file is several gigabytes, and the History page takes ten seconds to render a year-long view because it’s pulling 35,000 rows.
Vigil rolls up to coarser tiers on a timer:
| Tier | Cadence | Retention | Why this exists |
|---|---|---|---|
| Raw | 2.5 s | 7 days | The dashboard’s last-15-min view; outage detection |
| 1-min | 1 min | 14 days | The 1h–6h chart band needs more detail than 5-min, less than raw |
| 5-min | 5 min | 90 days | The 6h–7d band; balances precision and DB size |
| 1-hour | 1 hour | forever | The long view — multi-month uptime trends |
The 1-minute tier exists for chart legibility. A 6-hour view at 5-minute resolution is 72 points; raw is ~8,600. The sweet spot where recharts stays smooth and the line is actually readable is 60–360 points per series. The tier lets a single chart serve any time window without falling off either end.
Outages live in their own table and are never aggregated or pruned. The historical record is the whole point.
What I’ve Found Running It
Note: the numbers below are illustrative. I’m running Vigil at home daily, but the readings any one user sees depend on their ISP and building. Treat these as the kind of patterns Vigil surfaces, not as definitive measurements of any specific provider.
A few things have already shown up in the data that I wouldn’t have been able to prove without it:
| Pattern | What Vigil shows | Why it matters |
|---|---|---|
| The evening dip | p95 latency to Zoom edge climbs from ~25ms to ~80ms around 9 PM most weeknights, then recovers around 10:30 PM | Generic Speedtest doesn’t catch this — it’s a path-specific congestion issue, not bandwidth |
| ICMP ≠ TCP | ICMP to Teams = 99.5% reachable. TCP/443 to Teams = 97.8%. The 1.7% gap is the meaningful signal | ICMP-only tools (ping 8.8.8.8) tell you the network is up while the application is down |
| Router stays green during WAN outage | When the auto-detected router probe is at 100% and every external target is at 0%, the failure is upstream of the modem | Property managers can’t credibly blame “your Wi-Fi” against this evidence |
| Modem reboots have a fingerprint | Every probe fails for ~90s, router probe returns first, DNS recovers ~10s later, everything else last | Lets you verify whether claimed “overnight equipment resets” actually happened |
| Wi-Fi signal is mostly innocent | RSSI dips correlate weakly with outages — most outages occur with strong, stable signal | Steers the conversation upstream of the AP, where the actual problem usually lives |
The single most useful column is the last one. Most home network conversations end at “your Wi-Fi is bad.” A graph that shows the access point was healthy while the WAN-side probes were red moves the conversation past Wi-Fi entirely.
How Vigil Fits Among Other Tools
Vigil isn’t the only network tool out there. It’s the one that fits a specific niche:
| Tool | What it does | Use with Vigil? |
|---|---|---|
| Speedtest.net / fast.com | One-shot bandwidth measurement | Use these to confirm peak throughput; Vigil tells you when the path to specific services is failing |
mtr, ping, traceroute | Diagnostic command-line tools | Complementary — Vigil records continuously, mtr is for digging into a specific failure |
| PingPlotter | Continuous monitoring, Windows-first | Closest commercial peer; Vigil is OSS, cross-platform, and aimed at non-IT-pros |
| SmokePing | Server-side latency monitoring | Use SmokePing if you have infrastructure to host it; Vigil is desktop, no server needed |
| Carrier-grade NMS (PRTG, LibreNMS) | Multi-site SLA monitoring | Different scale entirely — Vigil is for one user, one connection |
Vigil’s niche: continuous, desktop, OSS, cross-platform, no server required, with reports designed for non-technical recipients. If you’re an IT pro monitoring 200 sites, use a real NMS. If you’re one person trying to prove the building’s network is broken, Vigil fits.
Known Limitations
Vigil is young. Here’s what it doesn’t do well yet:
- No multi-device aggregation. Each install is independent. You can’t merge data from your laptop and your partner’s laptop into one report.
- No alerting. It detects outages and shows them in the UI, but it won’t text you. Tray-icon notifications and an optional webhook are on the roadmap.
- No remote access. Vigil runs on your machine and writes to your local SQLite. No cloud sync, no shared dashboard.
- Probes are not sophisticated. They prove reachability, not call quality. A 99.9%-reachable Zoom endpoint with 200ms jitter still produces a bad call. WebRTC-style synthetic transactions are on the long-term roadmap.
- Windows builds are unsigned. SmartScreen flags them on first launch with the “Windows protected your PC” dialog — click More info → Run anyway. Azure Trusted Signing is on the roadmap; macOS and Linux installs are clean.
These aren’t deal-breakers for the use case I built it for — single user, single connection, evidence-gathering. They might be for yours.
When NOT to Use Vigil
- You have a constant outage. Constant outages don’t need evidence. Pick up the phone.
- You need carrier-grade observability across many sites. Use a real NMS — PRTG, LibreNMS, Datadog Network Monitoring.
- You’re debugging application-layer issues. Vigil tells you whether the network reaches a service. It doesn’t trace your specific API request.
- You want a server-side monitoring platform. Use SmokePing or Prometheus blackbox-exporter.
Try It
Download the latest release from GitHub Releases for your OS:
- macOS Apple Silicon:
Vigil_<version>_aarch64.dmg - macOS Intel:
Vigil_<version>_x64.dmg - Windows 10/11:
Vigil_<version>_x64-setup.msi - Linux (Debian/Ubuntu):
vigil_<version>_amd64.deb - Linux (everything else):
vigil_<version>_amd64.AppImage
Subsequent releases auto-update via tauri-plugin-updater — signed manifests served from updates.romans.dev.
Run it for a week. Generate the HTML report from the History page. Send it to whoever needs to see it. The blame stops looping when the data starts circulating.
If you hit rough edges, GitHub Issues is the right place. If you want a probe type Vigil doesn’t support yet (HTTP synthetic transactions, BGP RIB lookups, IPv6-specific probes), Discussions is where to start the conversation.
The code is on GitHub. macOS builds are signed and notarized — Gatekeeper opens them cleanly. Windows builds are still unsigned; SmartScreen will warn you once. That’s the next thing to fix.
Vigil is part of SID Technologies — small, focused tools, Roman names. The thread that runs through them: build the thing you needed last week, ship it open-source, write down what you learned.